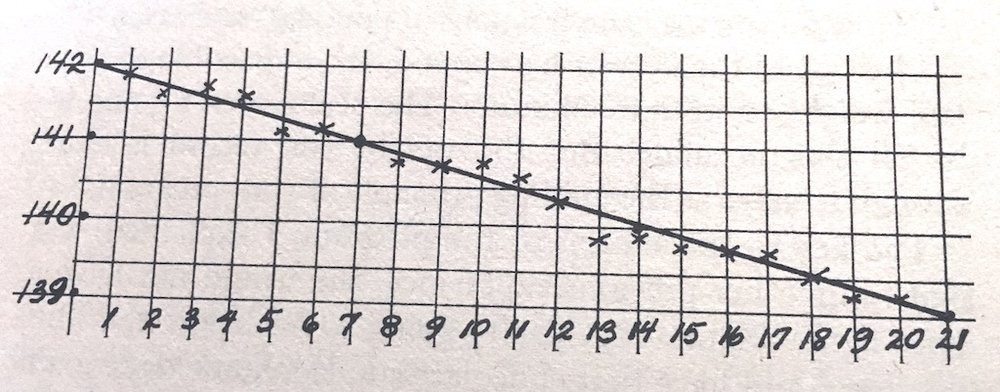
The key tool for me will be a weight-tracking chart made with pen and graph paper.
The chart format is described in the 1975 book Total Fitness in 30 Minutes a Week by Laurence E. Morehouse and Leonard Gross (long out of print). I first heard of this book through Mark Forster’s article.
The goal of the chart is to help you track losing a pound a week. This is a sustainable and non-superhuman rate of loss that should, we hope, prevent feelings of deprivation and will-power stuggles.
Here’s how Morehouse presents the graph in his book:

- Dates run along the horizontal axis.
- Weight is on the vertical axis. Each block on the graph represents a half-pound, so weight amounts are placed on every second line.
- Starting from the upper left, count down two blocks and over seven. Make a dot. Continue counting down two and over seven, making a dot at each intersection, till you get to the lower right. In the image, those dots are on days 7, 14, and 21.
- Use a ruler to draw a line from upper left to lower right connecting those dots.
That line determines your weight control program. My graph runs from 1/13 to 2/20, about 5 weeks. Every day I weigh myself, my weight will be above, below, or on the control line. For fractions of a pound, round up or down to the nearest half-pound.
Morehouse describes the protocol:
- The objective is to always be on the control line.
- If you’re below the line, eat what you want so you’re on the line tomorrow.
- If you’re above the line, then reduce the food and increase physical activity so you’re on the line tomorrow. Morehouse recommends eating 200 fewer calories and burning 300 extra calories by physical activity.
- By the end of the first week, you should know what foods or activity are needed to stay on or below the control line.
Morehouse makes the point that your daily weight will of course fluctuate for any number of reasons; some we can control, some we cannot. But for the purposes of this exercise, treat the weight as true and adjust accordingly. As Morehouse says,
We pay attention to the scale, particularly since it’s such a good source of motivation, but we don’t take it too seriously.
If you’re above the line for several days in a row, then it ain’t the weather; do what you need to do to bring your weight below the line. But if you're below the line, hooray! Take advantage of the fluctuation.
Keep tracking your weight in this way till you reach your target weight. In my case I’d like to be 195 lbs. So, if all goes well, I’ll get there sometime in mid-May.
There are spreadsheets out there (the Hacker’s Diet being one) that track one’s weight daily and smoothe out the fluctuations. And any app store is lousy with weight trackers.
So why use pen and paper? For one thing, I like looking at the chart and seeing how long this will take. It reminds me that sustainable weight loss is a slow process – slower than I’d like, frankly. But whenever I’ve tried to lose faster than this, I would rebound to some degree.
Making the chart involves me in the process and updating it every morning is also more active than simply typing my weight into an app. When I record the weight and note its position relative to the control line, I immediately begin planning my day’s eating and activities.
What do I do when I’m over the line? When I figure it out myself, I will post it here!